- Research
- Open access
- Published:
Correlation between the triglyceride-glucose index and left ventricular global longitudinal strain in patients with chronic heart failure: a cross-sectional study
Cardiovascular Diabetology volume 23, Article number: 182 (2024)
Abstract
Background
Left ventricular global longitudinal strain (GLS) holds greater diagnostic and prognostic value than left ventricular ejection fraction (LVEF) in the heart failure (HF) patients. The triglyceride-glucose (TyG) index serves as a reliable surrogate for insulin resistance (IR) and is strongly associated with several adverse cardiovascular events. However, there remains a research gap concerning the correlation between the TyG index and GLS among patients with chronic heart failure (CHF).
Method
427 CHF patients were included in the final analysis. Patient demographic information, along with laboratory tests such as blood glucose, lipids profiles, and echocardiographic data were collected. The TyG index was calculated as Ln [fasting triglyceride (TG) (mg/dL) × fasting plasma glucose (FPG) (mg/dL)/2].
Results
Among CHF patients, GLS was notably lower in the higher TyG index group compared to the lower TyG index group. Following adjustment for confounding factors, GLS demonstrated gradual decrease with increasing TyG index, regardless of the LVEF level and CHF classification.
Conclusion
Elevated TyG index may be independently associated with more severe clinical left ventricular dysfunction in patients with CHF.
Introduction
Heart failure (HF) is a major global medical challenge with an increasing prevalence and poor prognosis [1, 2]. Traditionally, HF has been broadly categorized according to the left ventricular ejection fraction (LVEF) into three groups: heart failure with reduced ejection fraction (HFrEF, LVEF is ≤ 40%), heart failure with mildly-reduced ejection fraction (HFmrEF, LVEF 41–49%), and heart failure with preserved ejection fraction (HFpEF, LVEF ≥ 50%), each exhibiting varying degrees of systolic and diastolic dysfunction [3, 4]. While LVEF, typically assessed via echocardiography, remains pivotal for HF diagnosis, characterization, prognosis, patient triage, and treatment selection [5, 6], However, this parameter is constrained not only by technical limitations but also by pathophysiological factors, including situations where the ratio of stroke volume to left ventricular (LV) cavity size remains unchanged [7]. Moreover, LVEF fails to differentiate between healthy hearts and HFpEF patients and inadequately reflects actual cardiac function [8, 9]. Strain analysis, emerging as a promising tool for evaluating cardiac contractility and myocardial deformation, offers a more comprehensive characterization of patients [10]. A growing number of studies have demonstrated that strain provides better predictor of prognostic value in HF patients compared to LVEF [5, 11,12,13].
Insulin resistance (IR), indictive of metabolic disorders and systemic inflammation, is an independent and significant risk factor for HF [14,15,16]. However, the gold standard method for measuring IR, the hyperinsulinemic-euglycemic clamp (HIEC), is time-consuming and invasive [17, 18], limiting its clinical applicability. The triglyceride-glucose (TyG) index has recently been regarded as a simpler, cost-effective, and reliable surrogate marker of IR, demonstrating high concordance with the HIEC [19,20,21]. Previous studies have found that the TyG index may play an essential role in the impairment of left ventricular structure and function [22, 23] and is associated with the development of HF and poor prognosis [24,25,26,27]. Na et al. reported an independent association between the higher TyG index and reduced GLS in patients with coronary artery disease (CAD) [28].
Although several recent studies have established a link between the TyG index and left ventricular function, no study has explored the relationship between the TyG index and GLS in CHF. Thus, we investigated the relationship between the TyG index and GLS in CHF patients and, for the first time, examining its relevance across different HF groups.
Methods
Study population
The study adhered to the principles outlined in the Declaration of Helsinki and was approved by the Ethics Review Committee of Qilu Hospital of Shandong University.
This retrospective study spanned from September 2020 to December 2023 and involved 573 consecutive patients presenting with CHF at Qilu Hospital of Shandong University. Among them, 49 patients were excluded due to poor image quality, 32 patients lacked fasting glucose and triglycerides, 26 patients were younger than 18 years old, and 39 patients had malignant neoplasms. Ultimately, 427 patients with CHF were included in the final analysis, comprising 175 HFrEF, 92 HFmrEF, and 160 HFpEF (Fig. 1).
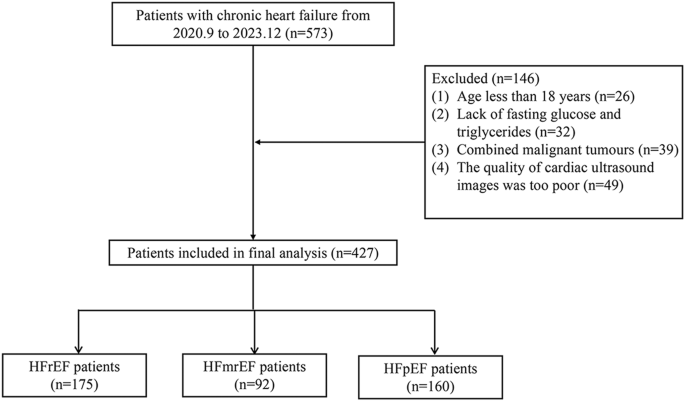
Flow diagram of patient selection
Echocardiographic measurement
Echocardiographic images were acquired by an experienced echocardiogram physician. Adhering to the 2016 guidelines provided by the American Society of Echocardiography and the European Society of Cardiovascular Imaging, participants were applied to the anterior chest area and connected to a three-lead ECG and we instructed all participants to hold their breath during image acquisition to ensure high-quality images [29]. The left ventricular end systolic volume (LVESV), left ventricular end diastolic volume (LVEDV), left ventricular end diastolic dimension (LVDd), left ventricular end systolic dimension (LVDs), left ventricular posterior wall thickness (LVPWT), interventricular septal thickness (IVST), LVEF and GLS was acquired by GEVividE95 color ultrasound diagnostic instrument (GE of USA) with an M5s probe and a frequency \(1.5 \sim 3.6\) MHz.
Data collection and definitions
Data on demographic characteristics, medical history, personal history, and medication usage were collected through an electronic medical record system. Venous blood samples were drawn after overnight fasting to measure levels of N-terminal pro-brain natriuretic peptide (NT-proBNP), fasting plasma glucose (FPG), serum creatinine (SCr), and lipid profile. CHF was defined according to the 2021 ESC Guidelines for the diagnosis and treatment of acute and chronic heart failure [30]. Body mass index (BMI) was calculated as weight (kg) divided by the square of height (m2). Hypertension was defined as systolic blood pressure ≥ 140 mmHg and/or diastolic blood pressure ≥ 90 mmHg, or the use of antihypertensive medication. Diabetes mellitus (DM) was defined as an FPG level ≥ 7.0 mmol/L or 2 h plasma glucose level ≥ 11.1 mmol/L following an oral glucose tolerance test (OGTT), or the use of oral hypoglycemic agents or insulin [31]. Hyperlipidemia was diagnosed with and ICD-10 code E78 along with lipid-lowering medication, or a total serum cholesterol ≥ 240 mg/dL) [32]. CAD was confirmed by the presence of at least one major coronary artery with ≥ 50% stenosis as evaluated by coronary angiography (CAG), including the left anterior descending, left circumflex, and right coronary arteries [33]. The diagnosis of obstructive sleep apnea (OSA) relied on an AHI ≥ 5/h, accompanied by suggestive symptoms according to the International Classification of Sleep Disorders (Third Edition) criteria [34]. Patients with a self-reported diagnosis of hypertension, DM, hyperlipidemia, CAD, or OSA, substantiated by corresponding medical records, were also identified as having these conditions. The estimated glomerular filtration rate (eGFR) was calculated using the following equations: eGFR (mL/min/1.73 m2) = 175 × SCr (mg/dL) −1.234 × age (year) −0.179 × 0.79 (in the case of women) [35]. Chronic kidney disease (CKD) was defined as an eGFR < 60 mL/min/1.73 m2. The TyG index was determined by the formula: Ln [fasting triglyceride (TG) (mg/dL) × FPG (mg/dL)/2] [21]. Reduced GLS is now defined as GLS < 11.2%, which represents the value of GLS less than the median in HF. Left ventricular mass (LVM, g) = 0.8 [1.04 (LVDd + LVPWT + LVST)3− (LVDd)3] + 0.6. Body surface area (BSA, m2) = 0.0061*height (cm) + 0.0128*weight (kg) − 0.1529. Left ventricular mass index (LVMi, g/m2) = LVM (g)/BAS(m2).
Statistical analysis
Statistical analysis was performed using SPSS version 25.0 (SPSS, Chicago, IL, United States), R software version 4.2.0 (R Foundation for Statistical Computing, Vienna, Austria), and GraphPad PRISM version 10.0 (GraphPad Software—San Diego, CA, USA). Initially, we assessed the baseline characteristics of the overall enrolled population and categorized them according to the tertile of the TyG index. Continuous variables were presented as mean ± standard deviation (SD) or median (interquartile range) and comparisons were made using Student’s t-test or Mann–Whitney U-test as appropriate. Categorical variables were expressed as counts and percentages and analyzed using the chi-square or Fisher exact tests. We used Pearson or Spearman correlation analysis to evaluate the association between the TyG index and cardiovascular risk factors in CHF, HFrEF, HFmrEF, and HFpEF. To mitigated bias from multicollinearity, we calculated the variance inflation factor (VIF) of the variables in the model (Additional file 1: Table S1). We did not find evidence of collinearity in the models, given the VIF of < 10. The association between the TyG index and GLS in CHF and its three subtypes was assessed using multivariable linear regression. Three models were constructed following adjusting for potential confounders: model 1 adjusted for age and gender; model 2 further adjusted for BMI, hypertension, CAD, DM, hyperlipidemia, OSA, smoking, and drinking; and model 3 additionally adjusted for LVEF, NT-proBNP, total cholesterol (TC), low-density lipoprotein cholesterol (LDL-C), high-density lipoprotein cholesterol (HDL-C), eGFR, E/e’, and LVMi. Furthermore, the TyG index was progressively included as both a continuous and categorical variable in multivariable logistic regression. To further explore the relationship between the TyG index and GLS, we employed restricted cubic spline curve (RCS) analysis. Subgroup analysis was conducted based on gender, hypertension, hyperlipidemia, DM, CAD, and BMI to assess potential variations in the association between the TyG index and GLS, with interaction P-values calculated accordingly. Finally, sensitivity analysis was performed by excluding patients with a history of lipid-lowering or glucose-lowering drug use, a history of sodium-glucose cotransporter-2 inhibitors (SGLT-2i) usage, and those with DM. Statistical significance was set at P-values less than 0.05.
Results
427 CHF patients were included in this study with a mean age of 48.37 ± 14.50 years, and 271 (63.5%) were males. As shown in Table 1, the patients were stratified into 3 groups according to the tertiles of the TyG index (tertile 1: n = 143, TyG index < 8.38; tertile 2: n = 141, 8.38 ≤ TyG index < 8.82; and tertile 3: n = 143, TyG index ≥ 8.82). As illustrated in Table 1, higher baseline TyG index was associated with increased prevalence of DM and hyperlipidemia as well as lower LVEF and GLS, and a higher ratio of males and patients with a history of coronary artery bypass grafting (CABG). Statistical significance was also found in other parameters such as E/e’, FPG, TC, LDL-C, HDL-C, TG, and hypoglycemic drug usage (all P-values < 0.05). No significant difference was observed in the other indicators (Table 1). Further comparisons of baseline characteristics of HFrEF, HFmrEF, and HFpEF was showed in Additional file 1: Table S2.
In CHF patients, there was a significant reduction in GLS with increasing TyG index, as depicted in Fig. 2 and Fig. 3. We plotted histograms and scatter plots in HFrEF, HFmrEF, and HFpEF and obtained similar results in HFrEF, HFmrEF, and HFpEF patients (Additional file 1: Figures S1, S2). Pearson or Spearman correlation analysis revealed significant positive correlations between the TyG index and TC and LDL-C (all P-values < 0.05) and negative association with HDL-C, LVEF, and GLS (all P-values < 0.05) (Table 2), with GLS demonstrating the strongest negative correlation (r = − 0.365, P < 0.001). Additional correlation analysis for the three HF types (HFrEF, HFmrEF, and HFpEF) are detailed in Additional file 1: Table S3.

Comparison of GLS of high TyG index group with low TyG index. TyG index triglyceride-glucose index, GLS global longitudinal strain

Scatterplot of GLS and TyG index for CHF. TyG index triglyceride-glucose index GLS global longitudinal strain, CHF chronic heart failure
Multivariable linear regression models were constructed to explore the independent association between the TyG index and GLS in CHF (Table 3). The β coefficients (95%CI) for the association between a 1-unit increase in the TyG index and decrease in GLS were documented as − 2.94 (− 3.70 to − 2.18), − 3.06 (− 3.84 to − 2.28), and − 1.99 (− 2.55 to − 1.44) in models 1, 2, and 3, respectively. In addition, when the TyG index was included as a categorical variable in the regression model, a significant linear trend with GLS was observed with a P-value < 0.05. In model 3, GLS for the highest tertile of TyG index decreased by 2.38 units [β (95% CI) − 2.38 (− 3.08 to − 1.68), P < 0.001], compared to the lowest tertile.
Multivariable logistic regression analysis revealed the TyG index as a risk factor for reduced GLS (Table 4). The risk of reduced GLS in CHF patients increased by 244%, 299%, and 337% with a 1-unit increase in the TyG index in models 1, 2, and 3, respectively. Similarly, compared to tertile 1, the risk of reduced GLS in tertile 3 surged by 306%, 398%, and 549% in models 1, 2, and 3, respectively. Similarly, we utilized multivariable linear and logistic regression analysis to investigated whether the TyG index is independently correlated with GLS in HFrEF, HFmrEF, and HFmrEF, with results being provided in Additional file 1: Tables S4, S5. We evaluated the continuous relationship between the TyG index and GLS using RCS based on a multivariable logistic regression model (Fig. 4). Following adjustments for traditional factors, the TyG index demonstrated a gradual increase, accompanied by a corresponding rise in the OR of the lower GLS. Furthermore, we explored the relationship between the TyG index and GLS in the three types of HF using RCS (Additional file 1: Figure S3). To validate the relationship between the TyG index and GLS, we conducted additional sensitivity analyses. Specifically, we excluded three groups of individuals from the analysis: group 1: those with DM; group 2: those with a history of lipid-lowering or hypoglycemic usage; group 3: those with a history of SGLT-2i usage (Table 5). The correlation between the TyG index and GLS was also present in three groups, which may indicate that the correlation is independent of medication and DM. We performed corresponding sensitivity analyses in different HF types (Additional file 1: Table S6).

Restricted cubic spline plot between the TyG index and reduced GLS. Reduced GLS: GLS < 11.2%. Adjusted for age, gender, BMI, hypertension, CAD, DM, hyperlipidemia, OSA, smoking, drinking, LVEF, NT-proBNP, TC, LDL-C, HDL-C, eGFR, E/e’, LVMi. TyG index triglyceride-glucose index, GLS global longitudinal strain BMI body mass index, CAD coronary artery disease, DM diabetes mellitus, OSA obstructive sleep apnea, LVEF left ventricular ejection fraction, NT-proBNP N-terminal pro-brain natriuretic peptide, TC total cholesterol, LDL-C low-density lipoprotein cholesterol, HDL-C, high-density lipoprotein cholesterol, eGFR estimated glomerular filtration rate, E/e’ the ratio of early diastolic mitral inflow velocity to septal mitral annulus tissue relaxation velocity in early diastole, LVMi left ventricular mass index
The association between the TyG index and GLS for CHF was examined in subgroup analyses, and the calculated interaction P values are shown in Fig. 5. No significant interaction was found. Across various groups, the TyG index exhibited statistical significance in predicting reduced GLS, suggesting stability and consistency in the TyG index and GLS relationship. Additionally, subgroup analyses were conducted in HFrEF, HFmrEF, and HFpEF (Additional file 1: Table S7).

Subgroup analysis of the correlation between TyG index and GLS in patients with CHF. TyG index triglyceride-glucose index GLS global longitudinal strain, CHF chronic heart failure, DM diabetes mellitus, CAD coronary artery disease, BMI body mass index
Discussion
In the present study, we investigated the relationship between the TyG index and GLS in CHF, and further explored this association across different subgroups. After multivariable linear and logistic regression, the TyG index emerged as an independent indicator of reduced GLS in CHF. Elevated TyG index remained independently associated with reduced GLS in all three groups of patients with HFrEF, HFmrEF and HFpEF. This suggests that an elevated TyG index may be independently associated with more severe left ventricular insufficiency in CHF, regardless of specific classifications of CHF and the levels of LVEF.
A growing number of studies have suggested that GLS outperforms LVEF as a prognostic marker in HF patients [5, 11,12,13, 36]. A previous study demonstrated GLS’s super prognostic value for mortality compared to LVEF in patients with acute heart failure (AHF) [36]. GLS is associated with cardiac death and all-cause mortality in patients with CHF, independent of clinical features and cardiac structure and function [12]. Similarly, GLS has independently predicted poor long-term prognosis of HFrEF [11], and HFpEF [5].
Moreover, the Atherosclerosis Risk in the community study have highlighted the association between hemoglobin A1c (HbA1c) levels and GLS, indicating a nearly linear relationship [37]. A study analyzing the Framingham Heart Study found a significant association between IR and hypertriglyceridemia and GLS [38]. Previous study found that while DM itself may not be directly associated with GLS, elevated HbA1c levels have been independently associated with GLS, suggesting a potential direct impact of glucose metabolism on myocardial function [12]. Li et al. reported that IR is a critical component of metabolic syndrome (MetS), accounting for > 90% of the association between MetS and HF risk [39].
Previous studies have shown that IR is prevalent in patients with HF, and precedes the development of HF [40]. IR is also an indicator of HF and heart function deterioration [41]. IR contributes to adverse cardiac remodeling and dysfunction, thereby increasing cardiovascular risk by inducing glucose and lipid metabolism imbalances and triggering oxidative stress and inflammatory responses, endothelial dysfunction, and ectopic lipid accumulation [14, 15, 42,43,44]. The TyG index, serving as a reliable surrogate for IR, exhibit a robust association with homeostasis model assessment of HIEC [19,20,21].
Most previous studies investigating the impact of elevated TyG index on cardiac function have predominantly focused on non-HF patients and long-term adverse events in various populations. Recently, several cohort studies have confirmed that the TyG index can play a predictive role in the development of HF [25, 27, 45]. Chen et al. identified a significant association between higher TyG index and subclinical LV systolic dysfunction in T2DM patients with LVEF ≥ 50% [23]. Similarly, Huang et al. showed that elevated baseline and long-term TyG index levels were significantly linked to an increased risk of adverse LV remodeling, LV dysfunction and an increased risk of HF in a US community population without HF and CAD [22]. Additionally, a cross-sectional study confirmed an independent association between elevated TyG index and reduced GLS in patients with CAD, suggesting a potential association between the TyG index and subclinical left ventricular dysfunction in CAD patients [28].
SGLT-2 inhibitors could modify myocardial metabolism and have a favorable effect on LV function [46,47,48]. Recognizing the interplay between LV remodeling, diastolic function, and LVGLS in prediabetes and diabetes [38, 49]. we conducted a sensitivity analysis. This involved excluding patients using SGLT-2i and those with DM, which showed no change in the correlation between the TyG index and GLS. In different subgroups, elevated TyG index was statistically associated with significant reductions in GLS, suggesting stability and consistency of the relationship in patients with CHF.
The TyG index is an easy-to-measure parameter that predicts the incidence of HF in populations ranging from those without DM and CAD to those with DM and CAD [22, 26, 50] and has demonstrated diagnostic ability in distinguishing HFpEF patients from non-HFpEF individuals [51]. Meanwhile, previous studies have shown that the TyG index is associated with a poor long-term prognosis in HF [25, 27, 45]. The TyG index can therefore be considered as an additional tool in the routine clinical assessment of individuals at risk of HF. In resource-limited countries and settings, heart failure clinics could benefit from incorporating the TyG into their routine assessment. [52]. Given its ease of measurement, the TyG index can help in stratifying HF patient risk, ultimately enabling healthcare providers to provide more personalized care and tailored advice to patients.
This study revealed that higher TyG index levels were associated with an increased risk of left ventricular insufficiency in CHF and all three types of HF despite adjusting for confounding factors (e.g. age, sex, smoking, hypertension, and diabetes). We also found that the TyG index was associated with a reduced strain of HF in non-DM patients and among those excluding glucose- lowering and lipid-lowering medications, suggesting the stability of the relationship between the TyG index and reduced GLS. By using a novel IR alternative index to the TyG index, our study underscores the important role of IR in strain reduction in selected patients with HF, providing new insights into the pathogenesis of left ventricular insufficiency across the three types of HF.
Limitation
Several limitations should be acknowledged in this study. (1) We acknowledged the limitations associated with the single-center, cross-sectional design of the study. This design may introduce bias, and we recognize the inability to assess whether the high TyG index group is more susceptible to subsequent adverse cardiovascular events compared to the low TyG index group. (2) While our study demonstrates relatively robust correlations between the TyG index and GLS in CHF across multiple multivariable models and subgroup analyses, we recognize the uncertainty regarding the utility of applying thees results to daily clinical practice. Further research is needed to determine the clinical implications of these findings. (3) We acknowledge the limitation posed by the different cutoff values for the TyG index among HF subgroups, which may restrict the generalization of the results to other populations. Understanding the variability of TyG index cutoffs across different HF subgroups is important for accurately interpreting and applying our findings in diverse clinical contexts. (4) We only analyzed patient GLS data and did not include assessments of left ventricular global circumferential strain or global radial strain, which could provide additional insights into cardiac function. (5) The use of a 2D scatter tracking technique for ultrasound image acquisition may be limited by acoustic window conditions, potentially impacting image quality and the analysis of hypoechoic regions. (6) Finally, we recognize the need for additional research to explore the relationship between the TyG index and GLS under the treatment of CHF. Investigating how the TyG index and GLS evolve in response to HF treatment could provide valuable insights into their clinical significance and potential therapeutic implications.
Conclusion
In summary, our findings suggested that a high TyG index in CHF patients may be independently associated with clinically more pronounced LV dysfunction. Therefore, monitoring TyG index levels could be crucial to mitigate subsequent adverse outcomes.
Availability of data and materials
The datasets used and/or analyzed during the current study are available from the corresponding author on reasonable request.
Abbreviations
- GLS:
-
Global longitudinal strain
- LVEF:
-
Left ventricular ejection fraction
- LV:
-
Left ventricular
- HF:
-
Heart failure
- TyG index:
-
Triglyceride-glucose index
- IR:
-
Insulin resistance
- CHF:
-
Chronic heart failure
- FPG:
-
Fasting plasma glucose
- TG:
-
Triglyceride
- HFrEF:
-
Heart failure with reduced ejection fraction
- HFmrEF:
-
Heart failure with mildly-reduced ejection fraction
- HFpEF:
-
Heart failure with preserved ejection fraction
- HIEC:
-
Hyperinsulinemic-euglycemic clamp
- CAD:
-
Coronary artery disease
- LVESV:
-
Left ventricular end systolic volume
- LVEDV:
-
Left ventricular end diastolic volume
- LVDd:
-
Left ventricular end diastolic dimension
- LVDs:
-
Left ventricular end systolic dimension
- LVPWT:
-
Left ventricular posterior wall thickness
- IVST:
-
Interventricular septal thickness
- NT-proBNP:
-
N-terminal pro-brain natriuretic peptide
- SCr:
-
Serum creatinine
- BMI:
-
Body mass index
- DM:
-
Diabetes mellitus
- OGTT:
-
Oral glucose tolerance test
- CAG:
-
Coronary angiography
- OSA:
-
Obstructive sleep apnea
- CKD:
-
Chronic kidney disease
- eGFR:
-
Estimated glomerular filtration rate
- LVM:
-
Left ventricular mass
- BSA:
-
Body surface area
- LVMi:
-
Left ventricular mass index
- TC:
-
Total cholesterol
- LDL-C:
-
Low-density lipoprotein cholesterol
- HDL-C:
-
High-density lipoprotein cholesterol
- RCS:
-
Restricted cubic spline
- AHF:
-
Acute heart failure
- HbA1c:
-
Hemoglobin A1c
References
McDonagh TA, Metra M, Adamo M, Gardner RS, Baumbach A, Böhm M, Burri H, Butler J, Čelutkienė J, Chioncel O, et al. ESC Guidelines for the diagnosis and treatment of acute and chronic heart failure: developed by the task force for the diagnosis and treatment of acute and chronic heart failure of the European society of cardiology (ESC). With the special contribution of the heart failure association (HFA) of the ESC. Eur J Heart Fail. 2022;24(1):4–131.
Shah KS, Xu H, Matsouaka RA, Bhatt DL, Heidenreich PA, Hernandez AF, Devore AD, Yancy CW, Fonarow GC. Heart failure with preserved, borderline, and reduced ejection fraction: 5-year outcomes. J Am Coll Cardiol. 2017;70(20):2476–86.
Yancy CW, Jessup M, Bozkurt B, Butler J, Casey DE Jr, Colvin MM, Drazner MH, Filippatos GS, Fonarow GC, Givertz MM, et al. 2017 ACC/AHA/HFSA focused update of the 2013 ACCF/AHA guideline for the management of heart failure: a report of the american college of cardiology/american heart association task force on clinical practice guidelines and the heart failure society of America. Circulation. 2017;136(6):e137–61.
Ponikowski P, Voors AA, Anker SD, Bueno H, Cleland JGF, Coats AJS, Falk V, González-Juanatey JR, Harjola VP, Jankowska EA, et al. 2016 ESC Guidelines for the diagnosis and treatment of acute and chronic heart failure: the task force for the diagnosis and treatment of acute and chronic heart failure of the European society of cardiology (ESC)Developed with the special contribution of the heart failure association (hFA) of the ESC. Eur Heart J. 2016;37(27):2129–200.
Brann A, Miller J, Eshraghian E, Park JJ, Greenberg B. Global longitudinal strain predicts clinical outcomes in patients with heart failure with preserved ejection fraction. Eur J Heart Fail. 2023;25(10):1755–65.
Curtis JP, Sokol SI, Wang Y, Rathore SS, Ko DT, Jadbabaie F, Portnay EL, Marshalko SJ, Radford MJ, Krumholz HM. The association of left ventricular ejection fraction, mortality, and cause of death in stable outpatients with heart failure. J Am Coll Cardiol. 2003;42(4):736–42.
Potter E, Marwick TH. Assessment of left ventricular function by echocardiography: the case for routinely adding global longitudinal strain to ejection fraction. JACC Cardiovasc Imaging. 2018;11(2 Pt 1):260–74.
Cikes M, Solomon SD. Beyond ejection fraction: an integrative approach for assessment of cardiac structure and function in heart failure. Eur Heart J. 2016;37(21):1642–50.
Hashemi D, Motzkus L, Blum M, Kraft R, Tanacli R, Tahirovic E, Doeblin P, Zieschang V, Zamani SM, Kelm M, et al. Myocardial deformation assessed among heart failure entities by cardiovascular magnetic resonance imaging. ESC Heart Fail. 2021;8(2):890–7.
Marwick TH, Shah SJ, Thomas JD. myocardial strain in the assessment of patients with heart failure: a review. JAMA Cardiol. 2019;4(3):287–94.
Sengeløv M, Jørgensen PG, Jensen JS, Bruun NE, Olsen FJ, Fritz-Hansen T, Nochioka K, Biering-Sørensen T. Global longitudinal strain is a superior predictor of all-cause mortality in heart failure with reduced ejection fraction. JACC Cardiovasc Imaging. 2015;8(12):1351–9.
Tröbs SO, Prochaska JH, Schwuchow-Thonke S, Schulz A, Müller F, Heidorn MW, Göbel S, Diestelmeier S, Lerma Monteverde J, Lackner KJ, et al. Association of global longitudinal strain with clinical status and mortality in patients with chronic heart failure. JAMA Cardiol. 2021;6(4):448–56.
Stanton T, Leano R, Marwick TH. Prediction of all-cause mortality from global longitudinal speckle strain: comparison with ejection fraction and wall motion scoring. Circ Cardiovasc Imaging. 2009;2(5):356–64.
Zheng L, Li B, Lin S, Chen L, Li H. Role and mechanism of cardiac insulin resistance in occurrence of heart failure caused by myocardial hypertrophy. Aging (Albany NY). 2019;11(16):6584–90.
Wamil M, Coleman RL, Adler AI, McMurray JJV, Holman RR. Increased risk of incident heart failure and death is associated with insulin resistance in people with newly diagnosed type 2 diabetes: UKPDS 89. Diabetes Care. 2021;44(8):1877–84.
Erqou S, Adler AI, Challa AA, Fonarow GC, Echouffo-Tcheugui JB. Insulin resistance and incident heart failure: a meta-analysis. Eur J Heart Fail. 2022;24(6):1139–41.
Rudvik A, Månsson M. Evaluation of surrogate measures of insulin sensitivity - correlation with gold standard is not enough. BMC Med Res Methodol. 2018;18(1):64.
Antuna-Puente B, Disse E, Rabasa-Lhoret R, Laville M, Capeau J, Bastard JP. How can we measure insulin sensitivity/resistance? Diabetes Metab. 2011;37(3):179–88.
Abbasi F, Reaven GM. Comparison of two methods using plasma triglyceride concentration as a surrogate estimate of insulin action in nondiabetic subjects: triglycerides × glucose versus triglyceride/high-density lipoprotein cholesterol. Metabolism. 2011;60(12):1673–6.
Vasques AC, Novaes FS, de Oliveira Mda S, Souza JR, Yamanaka A, Pareja JC, Tambascia MA, Saad MJ, Geloneze B. TyG index performs better than HOMA in a Brazilian population: a hyperglycemic clamp validated study. Diabetes Res Clin Pract. 2011;93(3):e98–100.
Guerrero-Romero F, Simental-Mendía LE, González-Ortiz M, Martínez-Abundis E, Ramos-Zavala MG, Hernández-González SO, Jacques-Camarena O, Rodríguez-Morán M. The product of triglycerides and glucose, a simple measure of insulin sensitivity comparison with the euglycemic-hyperinsulinemic clamp. J Clin Endocrinol Metab. 2010;95(7):3347–51.
Huang R, Lin Y, Ye X, Zhong X, Xie P, Li M, Zhuang X, Liao X. Triglyceride-glucose index in the development of heart failure and left ventricular dysfunction: analysis of the ARIC study. Eur J Prev Cardiol. 2022;29(11):1531–41.
Chen Y, Fu J, Wang Y, Zhang Y, Shi M, Wang C, Li M, Wang L, Liu X, Ta S, et al. Association between triglyceride glucose index and subclinical left ventricular systolic dysfunction in patients with type 2 diabetes. Lipids Health Dis. 2023;22(1):35.
Li X, Chan JSK, Guan B, Peng S, Wu X, Lu X, Zhou J, Hui JMH, Lee YHA, Satti DI, et al. Triglyceride-glucose index and the risk of heart failure: evidence from two large cohorts and a mendelian randomization analysis. Cardiovasc Diabetol. 2022;21(1):229.
Huang R, Wang Z, Chen J, Bao X, Xu N, Guo S, Gu R, Wang W, Wei Z, Wang L. Prognostic value of triglyceride glucose (TyG) index in patients with acute decompensated heart failure. Cardiovasc Diabetol. 2022;21(1):88.
Xu L, Wu M, Chen S, Yang Y, Wang Y, Wu S, Tian Y. Triglyceride-glucose index associates with incident heart failure: a cohort study. Diabetes Metab. 2022;48(6).
Zhou Y, Wang C, Che H, Cheng L, Zhu D, Rao C, Zhong Q, Li Z, Wang X, Wu Z, et al. Association between the triglyceride-glucose index and the risk of mortality among patients with chronic heart failure: results from a retrospective cohort study in China. Cardiovasc Diabetol. 2023;22(1):171.
Na L, Cui W, Li X, Chang J, Xue X. Association between the triglyceride-glucose index and left ventricular global longitudinal strain in patients with coronary heart disease in Jilin Province, China: a cross-sectional study. Cardiovasc Diabetol. 2023;22(1):321.
Lang RM, Badano LP, Mor-Avi V, Afilalo J, Armstrong A, Ernande L, Flachskampf FA, Foster E, Goldstein SA, Kuznetsova T, et al. Recommendations for cardiac chamber quantification by echocardiography in adults: an update from the American society of echocardiography and the european association of cardiovascular imaging. Eur Heart J Cardiovasc Imaging. 2015;16(3):233–70.
McDonagh TA, Metra M, Adamo M, Gardner RS, Baumbach A, Böhm M, Burri H, Butler J, Čelutkienė J, Chioncel O, et al. 2021 ESC Guidelines for the diagnosis and treatment of acute and chronic heart failure. Eur Heart J. 2021;42(36):3599–726.
ElSayed NA, Aleppo G, Aroda VR, Bannuru RR, Brown FM, Bruemmer D, Collins BS, Hilliard ME, Isaacs D, Johnson EL, et al. 2 classification and diagnosis of diabetes: standards of care in diabetes-2023. Diabetes Care. 2023;46(Suppl 1):S19-s40.
Hong S, Han K, Park CY. The triglyceride glucose index is a simple and low-cost marker associated with atherosclerotic cardiovascular disease: a population-based study. BMC Med. 2020;18(1):361.
Wang X, Xu W, Song Q, Zhao Z, Meng X, Xia C, Xie Y, Yang C, Jin P, Wang F. Association between the triglyceride-glucose index and severity of coronary artery disease. Cardiovasc Diabetol. 2022;21(1):168.
Bikov A, Frent SM, Meszaros M, Kunos L, Mathioudakis AG, Negru AG, Gaita L, Mihaicuta S. Triglyceride-glucose index in non-diabetic, non-obese patients with obstructive sleep apnoea. J Clin Med. 2021;10(9):1932.
Ma YC, Zuo L, Chen JH, Luo Q, Yu XQ, Li Y, Xu JS, Huang SM, Wang LN, Huang W, et al. Modified glomerular filtration rate estimating equation for Chinese patients with chronic kidney disease. J Am Soc Nephrol. 2006;17(10):2937–44.
Park JJ, Park JB, Park JH, Cho GY. Global longitudinal strain to predict mortality in patients with acute heart failure. J Am Coll Cardiol. 2018;71(18):1947–57.
Skali H, Shah A, Gupta DK, Cheng S, Claggett B, Liu J, Bello N, Aguilar D, Vardeny O, Matsushita K, et al. Cardiac structure and function across the glycemic spectrum in elderly men and women free of prevalent heart disease: the atherosclerosis risk in the community study. Circ Heart Fail. 2015;8(3):448–54.
Ho JE, McCabe EL, Wang TJ, Larson MG, Levy D, Tsao C, Aragam J, Mitchell GF, Benjamin EJ, Vasan RS, et al. Cardiometabolic traits and systolic mechanics in the community. Circ Heart Fail. 2017. https://doi.org/10.1161/CIRCHEARTFAILURE.116.003536.
Li C, Ford ES, McGuire LC, Mokdad AH. Association of metabolic syndrome and insulin resistance with congestive heart failure: findings from the third national health and nutrition examination survey. J Epidemiol Community Health. 2007;61(1):67–73.
Witteles RM, Fowler MB. Insulin-resistant cardiomyopathy clinical evidence, mechanisms, and treatment options. J Am Coll Cardiol. 2008;51(2):93–102.
Cai X, Liu X, Sun L, He Y, Zheng S, Zhang Y, Huang Y. Prediabetes and the risk of heart failure: a meta-analysis. Diabetes Obes Metab. 2021;23(8):1746–53.
Nishida K, Otsu K. Inflammation and metabolic cardiomyopathy. Cardiovasc Res. 2017;113(4):389–98.
Kolwicz SC Jr, Purohit S, Tian R. Cardiac metabolism and its interactions with contraction, growth, and survival of cardiomyocytes. Circ Res. 2013;113(5):603–16.
Samuelsson AM, Bollano E, Mobini R, Larsson BM, Omerovic E, Fu M, Waagstein F, Holmäng A. Hyperinsulinemia: effect on cardiac mass/function, angiotensin II receptor expression, and insulin signaling pathways. Am J Physiol Heart Circ Physiol. 2006;291(2):H787-796.
Zhou Q, Yang J, Tang H, Guo Z, Dong W, Wang Y, Meng X, Zhang K, Wang W, Shao C, et al. High triglyceride-glucose (TyG) index is associated with poor prognosis of heart failure with preserved ejection fraction. Cardiovasc Diabetol. 2023;22(1):263.
Tanaka H, Soga F, Tatsumi K, Mochizuki Y, Sano H, Toki H, Matsumoto K, Shite J, Takaoka H, Doi T, et al. Positive effect of dapagliflozin on left ventricular longitudinal function for type 2 diabetic mellitus patients with chronic heart failure. Cardiovasc Diabetol. 2020;19(1):6.
Nesti L, Pugliese NR, Sciuto P, Trico D, Dardano A, Baldi S, Pinnola S, Fabiani I, Di Bello V, Natali A. Effect of empagliflozin on left ventricular contractility and peak oxygen uptake in subjects with type 2 diabetes without heart disease: results of the EMPA-HEART trial. Cardiovasc Diabetol. 2022;21(1):181.
Palmiero G, Cesaro A, Galiero R, Loffredo G, Caturano A, Vetrano E, Rinaldi L, Salvatore T, Ruggiero R, Rosaria Di Palo M, et al. Impact of gliflozins on cardiac remodeling in patients with type 2 diabetes mellitus & reduced ejection fraction heart failure: a pilot prospective study. GLISCAR study Diabetes Res Clin Pract. 2023;2023(200).
Cheng S, McCabe EL, Larson MG, Merz AA, Osypiuk E, Lehman BT, Stantchev P, Aragam J, Solomon SD, Benjamin EJ, et al. Distinct aspects of left ventricular mechanical function are differentially associated with cardiovascular outcomes and all-cause mortality in the community. J Am Heart Assoc. 2015;4(10).
Tai S, Fu L, Zhang N, Zhou Y, Xing Z, Wang Y. Impact of baseline and trajectory of triglyceride-glucose index on cardiovascular outcomes in patients With type 2 diabetes mellitus. Front Endocrinol. 2022;13.
Liao LP, Yang Y, Wu Y, Li W. Correlation analysis of the triglyceride glucose index and heart failure with preserved ejection fraction in essential hypertensive patients. Clin Cardiol. 2022;45(9):936–42.
Khalaji A, Behnoush AH, Khanmohammadi S, Ghanbari Mardasi K, Sharifkashani S, Sahebkar A, Vinciguerra C, Cannavo A. Triglyceride-glucose index and heart failure: a systematic review and meta-analysis. Cardiovasc Diabetol. 2023;22(1):244.
Acknowledgements
We are grateful to all the subjects who participated in the study.
Funding
This work was supported by the National Key Research and Development Program of China (No.2021YFF0501403 and No.2021YFF0501404).
Author information
Authors and Affiliations
Contributions
SZ and YL drafted and revised the manuscript and contributed to the conception and design of this article. XP, QY, and FL contributed to the collection of cases and the organization of the database. SZ, TW and DG were responsible for the statistical analysis of the data. CZ, YL and HL interpreted the results. All authors read and approved the final manuscript.
Corresponding authors
Ethics declarations
Ethics approval and consent to participate
This study adhered to the principles outlined in the Declaration of Helsinki and was approved by the Ethics Review Committee of Qilu Hospital of Shandong University.
Consent for publication
Not applicable.
Competing interests
The authors declare that they have no competing interests.
Additional information
Publisher's Note
Springer Nature remains neutral with regard to jurisdictional claims in published maps and institutional affiliations.
Supplementary Information
Below is the link to the electronic supplementary material.
12933_2024_2259_MOESM1_ESM.docx
Supplementary material 1. Figure S1 Comparison of GLS between high TyG index group and control group in three heart failure types groups. Figure S2 Scatterplot of GLS versus TyG index for three heart failure types. Figure S3 Restricted cubic spline plot between the TyG index level and reduced GLS for three heart failure types. Table S1 Co-linearity analysis between covariates. Table S2 Baseline characteristics of the study population according to the heart failure group. Table S3 Correlation between TyG index and cardiovascular risk factors in three heart failure types. Table S4 multivariable variable linear regression in three heart failure types. Table S5 Multivariable logistic regression analysis in three heart failure types. Table S6 Sensitivity analysis: exclusion of patient with DM, hypoglycemic or lipid-lowering drug use and SGLT-2i use in three heart failure types. Table S7 Subgroup analysis in three heart failure types.
Rights and permissions
Open Access This article is licensed under a Creative Commons Attribution 4.0 International License, which permits use, sharing, adaptation, distribution and reproduction in any medium or format, as long as you give appropriate credit to the original author(s) and the source, provide a link to the Creative Commons licence, and indicate if changes were made. The images or other third party material in this article are included in the article’s Creative Commons licence, unless indicated otherwise in a credit line to the material. If material is not included in the article’s Creative Commons licence and your intended use is not permitted by statutory regulation or exceeds the permitted use, you will need to obtain permission directly from the copyright holder. To view a copy of this licence, visit http://creativecommons.org/licenses/by/4.0/. The Creative Commons Public Domain Dedication waiver (http://creativecommons.org/publicdomain/zero/1.0/) applies to the data made available in this article, unless otherwise stated in a credit line to the data.
About this article

Cite this article
Zhang, S., Liu, Y., Liu, F. et al. Correlation between the triglyceride-glucose index and left ventricular global longitudinal strain in patients with chronic heart failure: a cross-sectional study. Cardiovasc Diabetol 23, 182 (2024). https://doi.org/10.1186/s12933-024-02259-2
Received:
Accepted:
Published:
DOI: https://doi.org/10.1186/s12933-024-02259-2