Fig. 3
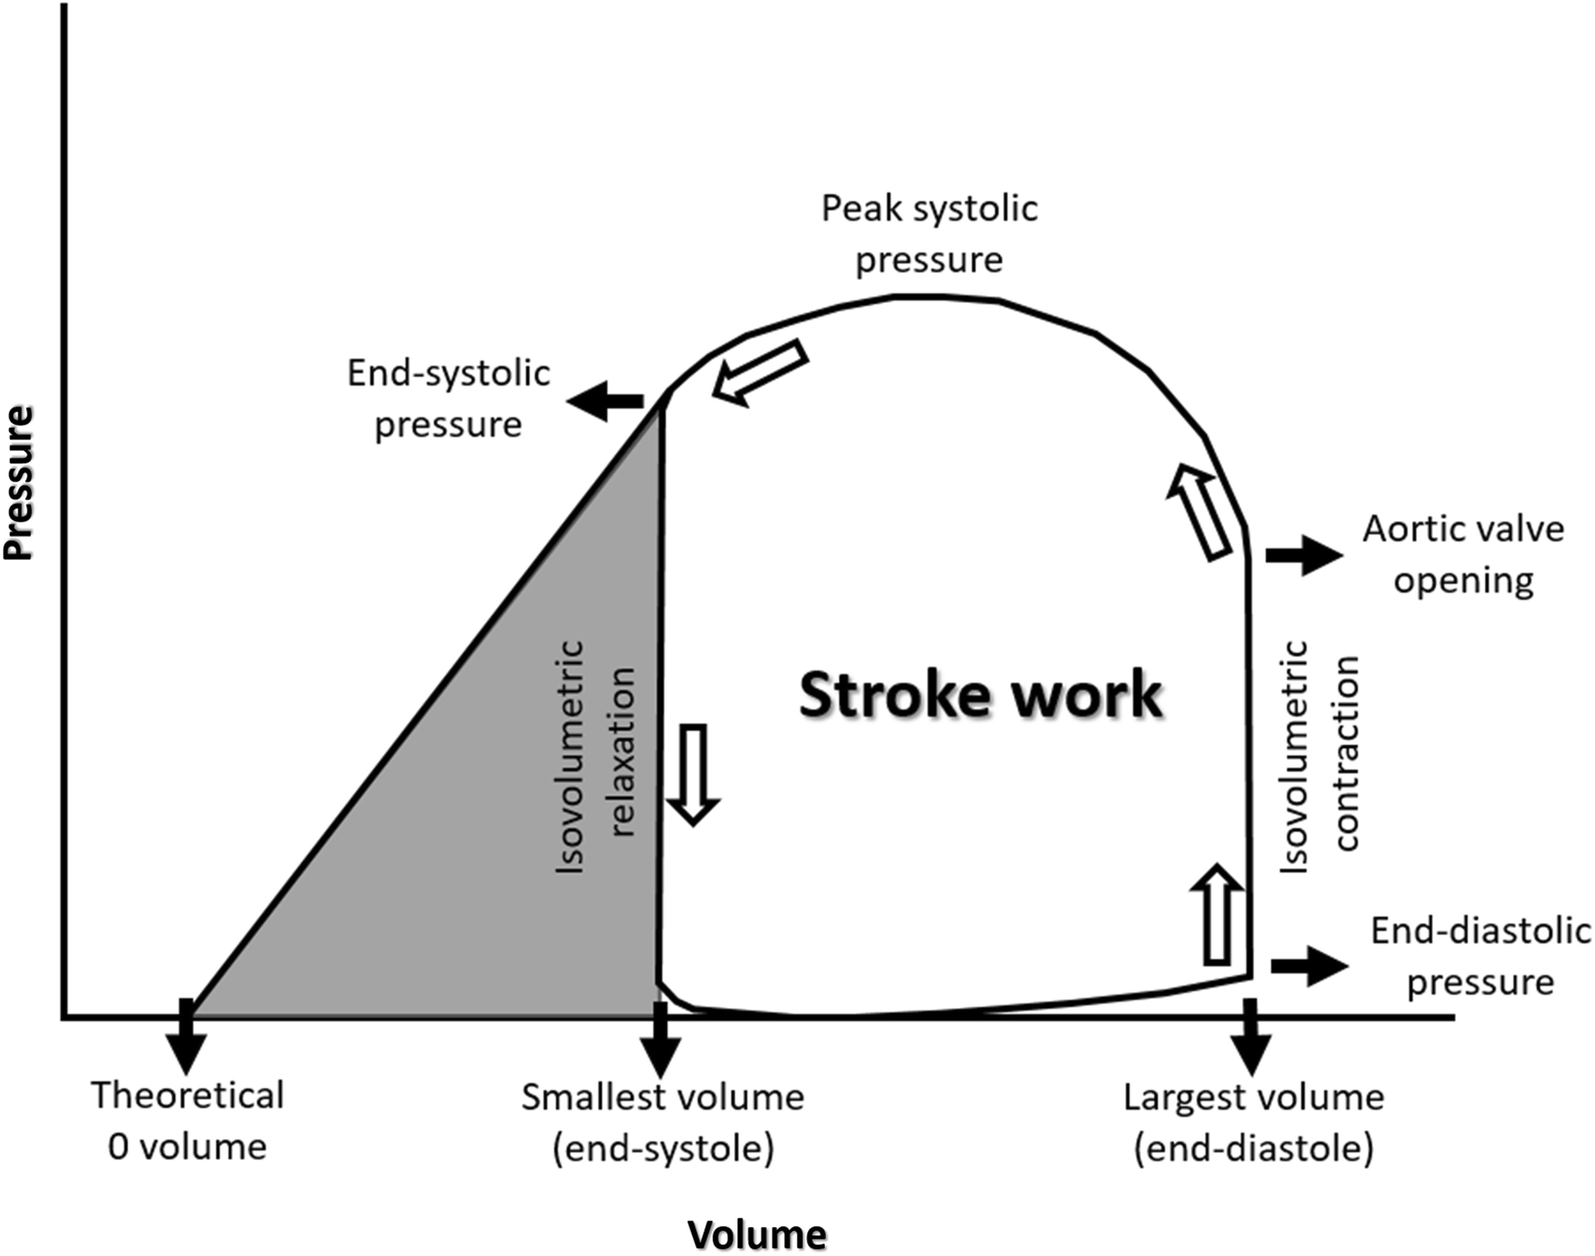
Pressure–volume loop with the indication of the different steps of cardiac cycle, starting with end-systolic volume and the lowest cavity pressure. Cardiac activity proceeds counterclockwise. Stroke work is the area of the loop than can be approximated as a dimensionless rectangle area with the basis represented by stroke volume and the height by peak-systolic pressure. The grey area is the potential energy developed